Measuring SaaS Utilisation: The Metrics That Matter
Aryan Malik · September 23, 2026
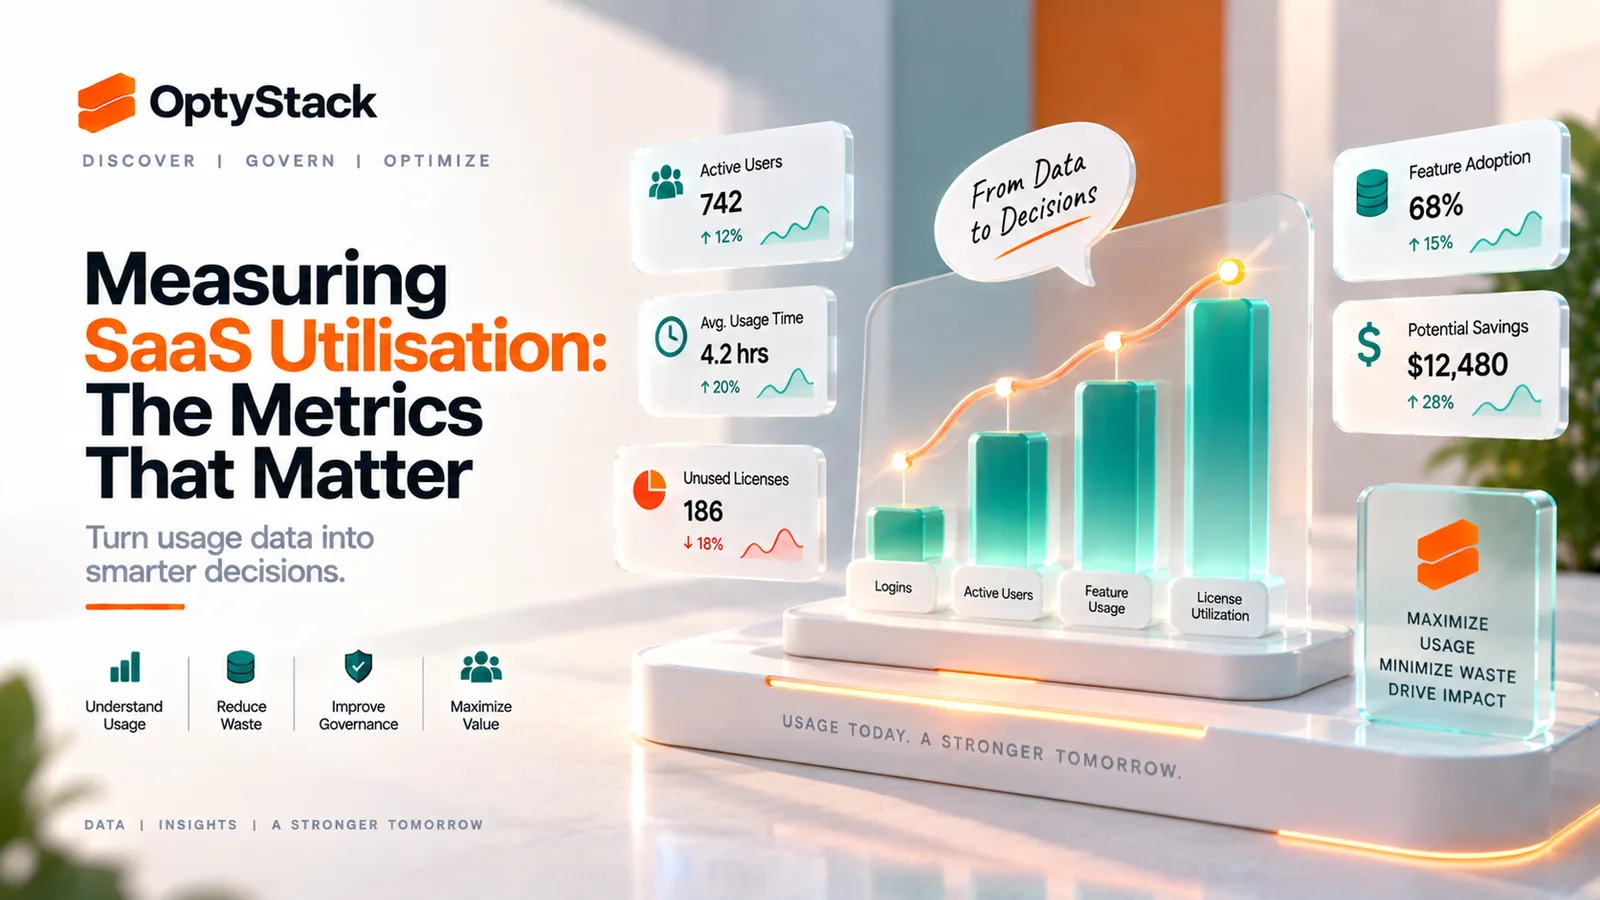
SaaS utilisation is more than counting logins. Learn how to measure licence utilisation, active users, activity patterns, feature adoption, cost per active user, and usage trends to make better software decisions.
A SaaS contract can tell you how many seats you bought and how much you paid. It cannot, by itself, tell you whether those seats are being used enough to justify the cost.
That is where SaaS utilisation comes in. The right metrics help IT, Finance, Procurement, and application owners distinguish between software that actively supports work, software that is used occasionally but still matters, and software that may be consuming budget without enough usage to justify its current footprint.
The challenge is choosing metrics that reflect real behaviour. A login alone does not prove meaningful use, and a low utilisation percentage does not automatically mean a tool should be cancelled. Good utilisation analysis combines access, activity, adoption, cost, and business context.
What SaaS Utilisation Actually Measures
SaaS utilisation is the extent to which purchased software capacity is actually being used.
For a seat-based application, the simplest comparison is licensed seats versus active users. But that is only the starting point. Someone can log in once every 60 days and still technically count as active, while another person may use a tool every day but only need a limited set of its features.
Utilisation should therefore be measured at several levels: whether a licence is assigned, whether it is being used, how frequently it is used, how deeply the product is being used where that data is available, and whether the current level of usage makes sense for the business purpose.
The Metrics That Matter Most
1. Licence utilisation rate. This is active users divided by licensed seats, multiplied by 100. If a company has 100 purchased seats and 72 users meeting its defined activity criteria, the utilisation rate is 72%.
The important part is defining what “active” means. A collaboration platform, financial reporting system, and incident-management tool may all have very different normal usage patterns.
2. Active user rate. Track the percentage of assigned users who actually use the application during a defined period. This adds another layer of context because a company might purchase 100 seats, assign 90, and have only 60 people actually using the application.
Comparing licensed, assigned, and active seats can reveal different types of over-provisioning.
3. Last activity date. The last login or activity date is a useful signal for identifying accounts that deserve investigation.
A long period without activity does not automatically mean a licence should be removed. A user may rely on the application only for month-end reporting, annual planning, or another infrequent but important workflow. Treat the last activity date as a review signal rather than an automatic cancellation rule.
4. Login frequency. Frequency adds context that a single last-activity date cannot provide.
Two employees may both have accessed an application during the last 30 days. One may use it every working day, while the other opened it once for a specific task. Both can appear “active” while having very different usage patterns.
5. Feature adoption. A login confirms access, but it does not necessarily show whether users are relying on the capabilities that justify the current subscription tier.
Where reliable feature-level data is available, compare the features being used with those included in the current plan. This can help identify situations where a premium plan may no longer match how the application is actually being used.
Feature-level data is not available or comparable across every SaaS application, so it should be treated as an additional signal rather than a universal requirement.
6. Utilisation by department or team. Company-wide utilisation can hide significant differences between teams.
Breaking usage down by department can show where adoption is concentrated, where licences may be sitting unused, and where different teams may be using overlapping applications for similar workflows.
7. Utilisation trend over time. A single snapshot only tells you what was happening at one point in time.
Tracking utilisation over several months shows whether adoption is increasing, stable, or declining. A tool with 80% utilisation today but a steady downward trend may deserve a different review from one that has maintained similar usage throughout the year.
8. Cost per active user. Divide relevant annual SaaS spend by the number of active users to calculate a simple efficiency measure.
For example, a $24,000 annual contract with 120 active users has a cost of $200 per active user. With 40 active users, the figure becomes $600.
That number is useful for comparison and investigation, but it is not a standalone measure of software value. A specialist application used by a small finance or engineering team may have a high cost per active user and still be essential to the business. Business criticality, workflow dependency, user roles, and the consequences of removing the application all matter.
What Good SaaS Utilisation Looks Like
There is no universal utilisation percentage that means a SaaS application is performing well.
A high-frequency collaboration platform may reasonably be expected to show regular activity across most assigned users. A compliance application may have a much smaller user group and still be important. A seasonal tool might show limited activity for several months and then become heavily used during a specific period.
The right benchmark is therefore tied to how the application is supposed to be used.
Ask:
Are the people who need the tool using it?
Is the usage pattern consistent with the business purpose?
Are the capabilities being used enough to justify the current plan or tier?
Is utilisation improving, stable, or declining?
Would reducing seats, changing the plan, or removing the tool create operational problems?
This approach is more useful than applying a fixed threshold to every application in the SaaS estate.
How to Measure Utilisation Without Misleading Yourself
The most common mistake is treating every application the same.
A CRM may be expected to show frequent activity. A finance system may be used heavily during specific reporting periods. An incident-management platform may remain quiet for weeks and become critical when an incident occurs.
Set an activity definition that reflects the application's normal operating pattern, and apply it consistently enough to compare usage over time.
It also helps to separate four questions:
Is the licence assigned? This tells you about provisioning.
Is the user authenticating? This tells you about access or login activity.
Is the application being meaningfully used? This requires stronger usage signals where available.
Is the current usage sufficient to justify the cost or plan tier? This requires business context rather than telemetry alone.
Keeping these questions separate prevents the common mistake of treating an authentication event as proof that a licence is fully utilised.
SaaS Utilisation vs. License Optimisation
These two concepts are closely connected, but they are not the same thing.
Utilisation measurement tells you how software is being accessed and used.
License optimisation uses that information alongside pricing, contract terms, business requirements, user roles, and future demand to decide what action makes sense.
For example, low utilisation might lead to a seat reduction, reassignment, plan downgrade, additional training, or no change at all if the application is business-critical.
Utilisation is therefore an input into a decision, not the decision itself.
A Practical SaaS Utilisation Dashboard
A useful dashboard can bring the core metrics into one place:
Metric | Example |
|---|---|
Licensed seats | 100 |
Assigned seats | 90 |
Active users | 72 |
Utilisation rate | 72% |
Last activity range | 3–94 days |
Annual SaaS spend | $24,000 |
Cost per active user | $333 |
Utilisation trend | Down 8% over 6 months |
Renewal date | 4 months away |
The value comes from looking at these numbers together.
A 72% utilisation rate can mean something very different when the remaining seats are reserved for planned hiring than when activity has been falling steadily and the application is approaching renewal.
Turning Utilisation Metrics Into Decisions
Metrics only become useful when they lead to a decision.
High utilisation and stable adoption can support continuing the application, assuming it still meets the business need and the pricing remains appropriate.
Low utilisation with strong business dependency may point toward training, workflow changes, or a different licensing model rather than cancellation.
Low utilisation with declining activity can justify investigating seat reduction, reassignment, a downgrade, or replacement.
High login frequency but limited feature usage may indicate that the current plan includes capabilities the organisation is not using.
The purpose of utilisation analysis is not to produce a score. It is to give application owners and decision-makers better evidence before changing what the company pays for.
How Often Should SaaS Utilisation Be Reviewed?
The right cadence depends on how quickly usage changes, how expensive the application is, and how important it is to the business.
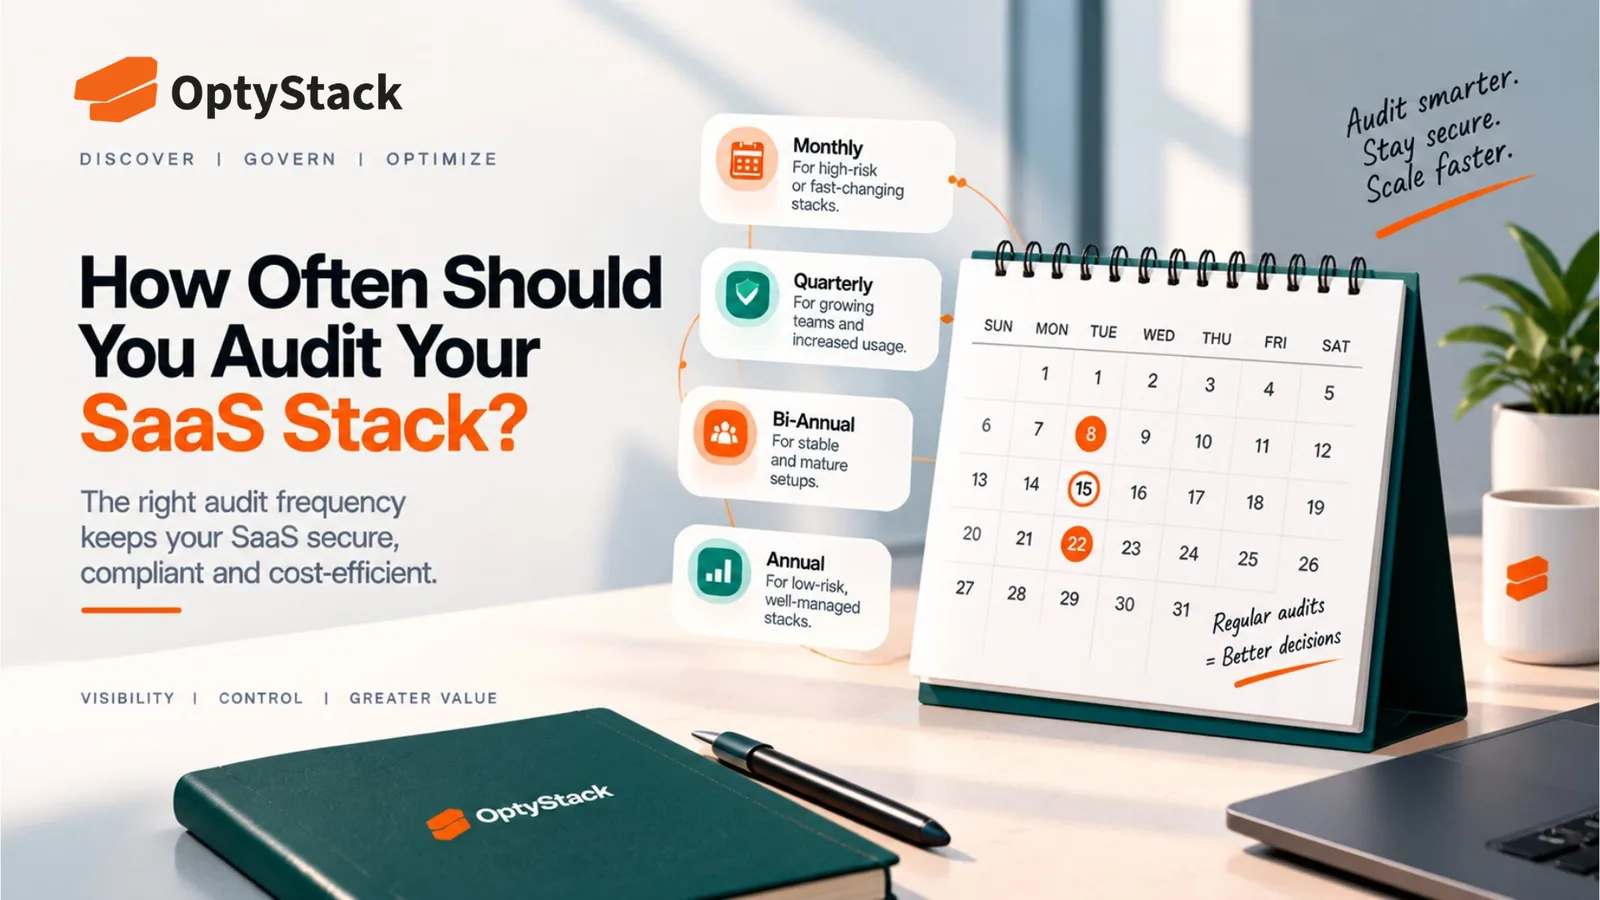
Many teams can use a light monthly check to identify obvious inactivity, major changes in usage, and newly idle seats.
A quarterly review can be useful for looking at broader utilisation trends, department-level adoption, plan tiers, and applications approaching renewal.
For high-spend or business-critical applications, teams may choose to review relevant utilisation signals more frequently. Renewal decisions should also incorporate the latest available usage information early enough to act on it.
The important part is making utilisation an ongoing management signal rather than a report created only when a contract is about to renew.
Where OptyStack Fits
Measuring utilisation across a large SaaS estate becomes difficult when every application keeps its own usage data and teams have to collect and reconcile that information manually.
OptyStack brings application, spend, identity, and usage signals together across your SaaS estate, helping teams connect what they pay for with who has access and how applications are being used.
That gives IT, Finance, and application owners a more consistent basis for investigating under-utilisation, reviewing plan fit, and preparing for renewal decisions without rebuilding the same picture manually each time.
It's free to start and doesn't require a credit card.
Turn SaaS usage data into better decisions. Start free with OptyStack.